How to measure server workload without losing your mind
Published on 2026-09-12 by frfrand
Cuatro números que dicen casi todo, qué significa realmente el load average, por qué el uso de CPU engaña, y en qué orden mirar cuando algo va lento.

A server is running slow. You open four tools, see numbers, and it's not clear which one to look at. The problem isn't lack of data: it's the order.
These are the four numbers, in the order you should read them.
1. The load average
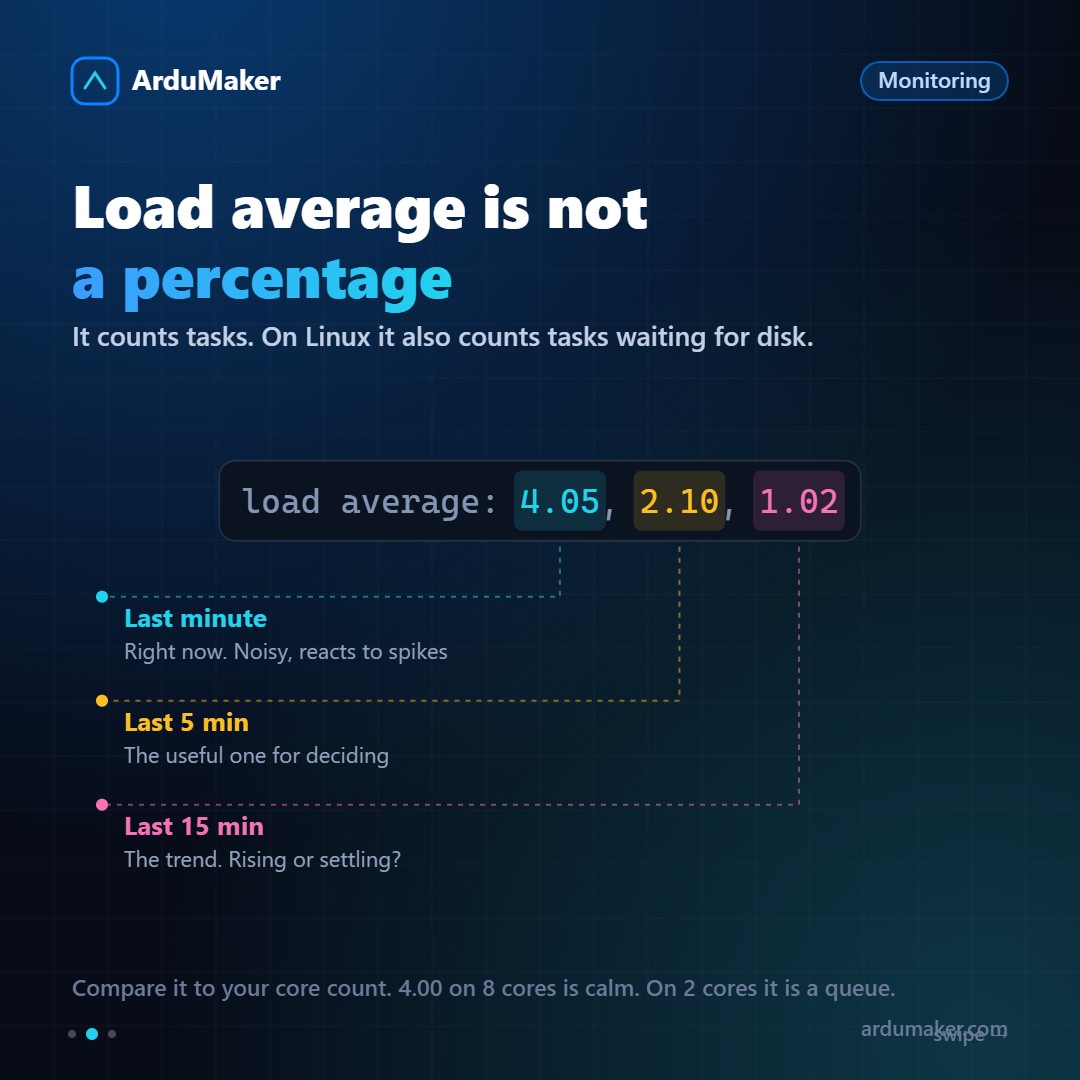
$ uptime load average: 4.05, 2.10, 1.02
The three values are the average over the last minute, the last five minutes, and the last fifteen minutes.
First: it is not a percentage. It counts tasks that are executing or waiting for their turn. A value of 4 means "on average, there are four tasks wanting to run".
To interpret it, you must compare it with the number of cores:
- 4.00 on an 8-core machine: calm, plenty of capacity available.
- 4.00 on a 2-core machine: there's a queue, tasks are waiting.
And a Linux peculiarity that confuses many people: it also counts tasks waiting for the disk. That's why a server with a saturated disk can show very high load even with the processor nearly idle. It's not a measurement error: it correctly describes that work is stuck.
The three numbers together tell a story: if the one-minute value is much higher than the fifteen-minute value, something has just started. If it's the opposite, it's already decreasing.
2. Memory
$ free -h
The column to look at is available, not "free".
Having "free" low is normal and good: Linux uses spare memory as disk cache, and frees it when needed. A server with a lot of "free" memory is wasting it.
What really matters: if "available" is low and swap is active. You can see this with:
$ vmstat 1
The "si" and "so" columns (swap in and out). If there's constant activity there, the server is moving data to disk because it doesn't fit in memory, and latency multiplies by a thousand.
3. The disk
$ iostat -x 1
Two things: utilization percentage and wait time. A disk at 100% with high wait times is the bottleneck, and from the outside it looks like "the application is slow".
This is the number most often overlooked, and the one that most frequently turns out to be the cause.
4. The processor, at the end
$ top
It's left for last because it's the most misleading.
A server at 100% CPU can be perfectly fine: it's using what you paid for. And a server at 20% can be crawling, because it's waiting for disk or network.
Inside top, the column that gives the most information is "wa" (I/O wait time). If it's high, the processor is waiting for the disk: the problem isn't the processor.
And "st" (stolen time): the hypervisor is giving your CPU cycles to another VM. If it's high and consistent, you're competing with neighbors.
The number almost nobody measures
Averages hide exactly what hurts.
If one in twenty requests takes five seconds and the rest take a hundred milliseconds, the average looks fine and users are angry.
That's why it's useful to measure percentiles. The 95th percentile says: 95% of requests were faster than this value. It's the common worst case, and it's what people actually experience.
If you're going to measure just one thing about your application's latency, measure the 95th percentile.
And what gives it meaning
A number without context is useless. Knowing the load is 3 means nothing; knowing it was 0.8 a week ago means everything.
That's why monitoring with history is worth more than any instant dashboard. In ArduMaker, the status system continuously checks hosts, VPSs, and domains in a cycle and stores 45 days of history, which allows answering "how long has this been going on?" instead of just looking at an isolated number.